Skip to contentInformation for people with disabilityInformation on accessibility

In both 2001 and 2004, Port Adelaide had a total of six candidates on the ballot for the House of Representatives. Overall informality increased from 6.86 percent to 7.08 percent. Amongst the four targeted polling stations, informality decreased by between by between 0.51 and 1.48 percentage points. (For a breakdown of informality levels at each polling place refer to Appendix A)
Voters in households with non-English speaking backgrounds who receive a voter educational letter in their language from the AEC will be more likely to vote formally. A voter education campaign should also decrease certain categories of informality which are most indicative of a lack of understanding of the voting system: ticks and crosses, number '1' only, and non-sequential.
Informality levels for 2001 and 2004 at the targeted polling stations were compared and analysed. Following is a summary of the change in informality among the four targeted polling places (plus Ferryden Park) in the Division of Port Adelaide.
| Percent of electors who received letters: 87.8 % |
swing between 2001–2004 | |||||
|---|---|---|---|---|---|---|
| Category of Informality | Allenby Gardens 11.5% Greek |
Ferrydon Park 11.5% Vietnamese |
Findon North 14.9% Italian |
Pennington 16.9% Vietnamese |
Woodville Gardens 22.6% Vietnamese |
Division of Port Adelaide |
| Blanks | -6.50 | -0.03 | 3.30 | 8.44 | -5.37 | 1.26 |
| Number '1' Only | 15.74 | 9.18 | -4.94 | -18.28 | -8.57 | -2.96 |
| Ticks and Crosses | 2.27 | -4.04% | -6.06 | 3.96 | 0.23 | 2.96 |
| Non-sequential | -16.39 | -10.83 | -3.11 | 3.59 | 3.54 | -7.65 |
| Voter Identified | 0.00 | 0.00 | 0.00 | 0.00 | 0.00 | 0.12 |
| Marks | -2.53 | -1.18 | 7.23 | -0.61 | -2.40 | -2.55 |
| Slogans making numbers illegible | 0.00 | 0.00 | 0.00 | -0.97 | 0.00 | 0.21 |
| Incomplete Numbering (not tallied separately in 2001) | N/A | N/A | N/A | N/A | N/A | N/A |
| Langer Style/Other [8] | N/A | N/A | N/A | N/A | N/A | N/A |
| Total informality 2001 | 6.91 | 8.15 | 8.18 | 8.96 | 9.57 | 6.86 |
| Total informality 2004 | 6.40 | 7.86 | 7.58 | 7.48 | 8.11 | 7.08 |
| Percent of electors who received letters | 87.80 | 30.20 | 42.90 | 72.80 | 61.10 | 8.66 |
| Total number [9] of informal ballots - 2004 | 81 | 102 | 156 | 129 | 175 | N/A |
Whilst there was a decrease in the overall informality levels amongst those polling places attended by electors who had received a letter, the decrease in different types of informality by category varied by polling place with no one category decreasing across all polling places. [10] The only marginal exception was the category of Number '1' Only, which decreased in four out of the five examined polling stations. This category also decreased by 2.96 percentage points at the Divisional level.
The lack of a consistent decrease in informality among the individual categories (particularly '1' only, ticks and crosses, and non-sequential) renders it difficult to confirm the level success of the voter education campaign in targeting certain types of informality. However it indicates that voter education campaigns may have a positive influence given that overall informality decreased in all five polling stations.
Voter education campaigns may have a varying impact on informality among different Non-English Speaking Background communities
The analysis conducted in the 2001 study on informality revealed that the variable "Not Fluent in English" is the major predictor of informality rates and highly statistically significant. However, differences among different non-English speaking background populations were not incorporated into this analysis.
It could be argued that voter education campaigns may have an impact on lowering informality levels in some communities only. According to International Idea's map of Electoral Systems of the World, there are only three countries in the world with an Alternative Vote (Full Preferential) system: Australia, Papua New Guinea and Fiji. [11] Most new citizens, regardless of their proficiency in English, will be from a country with a different voting system to Australia's.
Many second or third-generation Australian electors may be fluent in English, in which case receiving a letter in their native language would not address the cause of informality. In contrast, more recent arrivals with poorer English language skills may benefit from new information contained in the letter in their native language, impacting upon their ability to vote formally.
To determine whether or not there is a difference among these electors and informality levels, further data was collected and analysed to ascertain a possible correlation between informality and discrete language groups. Differences among the language groups would suggest that informality levels may be influenced by voter education campaigns within targeted communities.
To test this hypothesis, a regression was performed which examined informality levels against the percentage of Greek, Italian and Vietnamese electors in each polling place for Port Adelaide. First, the foreign language divisional profile of Port Adelaide was extracted. This profile of data includes numbers of electors in each polling place catchment area.
The regressions revealed the following: There is no correlation between informality levels and levels of Greek or Italian-speaking electors. Greek or Italian-speaking electors are no more likely to vote informally than any other elector.
However, there is a strong correlation between informality levels and levels of Vietnamese-speaking electors. More analysis also reveals that there is a correlation between Vietnamese-speaking levels and ballots informal due to number '1' only.
Figure 1: Correlation scattergram – 2004 informality levels and levels of Vietnamese-speaking electors
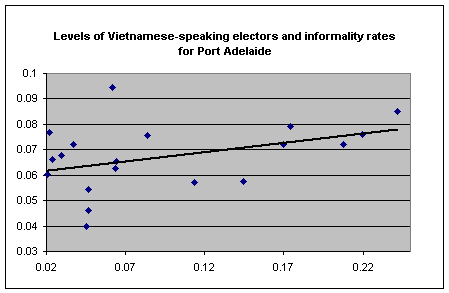
This suggests that while analysis of the 2001 federal election confirmed that there is a correlation between electors with non-English speaking backgrounds and informality rates, the correlation exists only with certain communities of non-English speaking electors.
With this information, we can re-examine the results of the pilot, and would expect a decrease in informality in targeted polling stations with higher levels of Vietnamese-speaking populations. Of the five polling stations with the highest levels of electors having received a letter, Pennington and Woodville Gardens have the highest levels of Vietnamese-speaking electors at 16.9 percent and 22.6 percent of the general population, respectively. (Please refer to Appendix C.) In these two polling stations, informality dropped by 1.48 and 1.46 percentage points, and the category of "Number '1' Only" dropped by 18.28 and 8.57 percentage points, respectively.
This strongly suggests that the second hypothesis – that voter education campaigns may have a varying impact on informality amongst different Non English Speaking background communities – is likely to be true. The analysis suggests that the instructional letters may have indeed had an impact on reducing informality levels among Vietnamese-speaking electors.
For the next campaign the AEC could address informality levels in these communities nation-wide through targeted information campaigns. This also suggests that the AEC could construct further tests to examine differences among non-English speaking communities that could also refine voter education campaigns to lower overall informality.
The AEC acknowledges the Traditional Owners of Country throughout Australia and recognises their continuing connection to land, waters, culture and community. We pay our respects to Elders past, present and emerging.