Skip to contentInformation for people with disabilityInformation on accessibility

Most recently, the AEC has produced research papers analysing informality at the 2001 and 2004 Federal elections, and the 2005 Werriwa by-election. This report provides an analysis and overview of trends in informal voting and differences in electoral systems in State and Territory lower house elections.
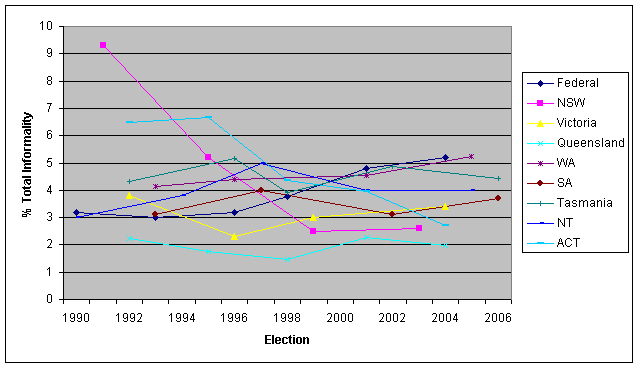
This report focuses on total informality rates from 1990 to 2005, but earlier statistics and the results of more detailed ballot paper surveys have been included where available. Statistics are sourced from State and Territory electoral bodies, and the data available varies for each State and Territory.
| 1989 | 1991 | 1995 | 1999 | 2003 |
|---|---|---|---|---|
| 3.3% | 9.3% | 5.2% | 2.5% | 2.6% |
New South Wales has had optional preferential voting in the Legislative Assembly since 1979. Voters are asked to mark a number one for their first preference, and then any further preferences if they wish.
From 3.3% informality at the 1989 election, the rate jumped to 9.3% in 1991. A tick or cross had been a valid first preference since 1982, but was declared informal in 1990. The concurrent referendum to reform the Legislative Council also meant that voters were faced with three ballots and three different voting systems, with different formality rules for each.
Informality decreased to 5.2% at the 1995 election, after which the formality rules were revised and a tick or cross were once again considered formal. In the following elections, informality decreased again to 2.5% in 1999 and 2.6% in 2003.
| 1992 | 1996 | 1999 | 2002 |
|---|---|---|---|
| 3.8% | 2.3% | 3.0% | 3.4% |
Like the Federal House of Representatives, the Victorian Legislative Assembly uses a full preferential system. It has had full preferential voting in the Legislative Council, but will change to proportional representation similar to the Federal Senate in 2006.
Informality has been lower than at Federal elections, but has been gradually increasing since the mid-1990s.
The requirement for full preferential voting for both houses in Victorian state elections may have reduced the confusion caused by the two different systems for Federal elections. After the new Legislative Council voting system is put in place at the 2006 election, the influence of having separate systems for the houses might be more easily determined.
| 1992 | 1995 | 1998 | 2001 | 2004 |
|---|---|---|---|---|
| 2.3% | 1.8% | 1.5% | 2.3% | 2.0% |
Optional preferential voting was re-introduced in Queensland in 1992, after using the full preferential system since 1942. Voters can indicate a first preference only, or fill out as many further preferences as they wish. Queensland abolished its upper house of parliament in 1922.
Queensland State elections have had an extremely low level of informality since the introduction of optional preferential voting in 1992, never exceeding 3%. With only one house of Parliament, Queensland voters have only one ballot paper and voting system in State elections. They then face two additional systems (full preferential and proportional) when voting in Federal elections.
| 1989 | 1993 | 1996 | 2001 | 2005 |
|---|---|---|---|---|
| 7.4% | 4.1% | 4.4% | 4.5% | 5.2% |
Western Australia has the same full preferential voting system as in the Federal House of Representatives. It does not have the unique features (optional preferential, ticket voting, one house etc.) of the other States and Territories.
Informality was very high in 1989, at 7.35%. This may have been due to confusion about the introduction of proportional voting in the Legislative Council. Rates of informal voting dropped to 4.13% at the next election in 1993, and have since increased steadily, to 5.24% in 2005. While this trend echoes that for Federal elections, informality rates are higher than Federal elections and most other States and Territories.
| 1979 | 1982 | 1985 | 1989 | 1993 | 1997 | 2002 | 2006 |
|---|---|---|---|---|---|---|---|
| 4.4% | 5.8% | 3.5% | 2.8% | 3.1% | 4.0% | 3.1% | 3.7% |
The South Australian lower house (House of Assembly) uses the same full preferential system as the Federal House of Representatives. The two points of difference are the practice of ticket voting in the House, and the ballot paper instructions.
Since 1985, if an elector marks a first preference only for the House of Assembly, the vote is 'saved' from being informal and completed by a voting ticket, similar to an 'above the line' vote in the Senate. It is illegal to advertise this provision or encourage voting in any way other than full preferential.
South Australian ballot papers contain the message that voters are not legally obliged to mark the ballot paper.
In the 2002 state election, 42.3% of informal ballot papers were blank. This seems high compared to Federal levels, but Federal informal ballots are dominated by '1 only' votes which are made formal in SA. When blank ballot papers are analysed as a percentage of the total ballots cast, 1.32% of all 2002 SA state election ballots were blank, compared to 1.02% (2001) and 1.1% (2004) of all Federal Election ballots. At the 2005 WA state election, which has a similar voting system to SA, 1.62% of all ballot papers were blank. There is a lack of data available for comparison, but the proportion of blank ballots in SA seems to be similar to or only slightly higher than Federal and other State elections.
Informality in South Australian elections is generally lower than in Federal elections, most likely due to the ticket voting provision.
| 1992 | 1996 | 1998 | 2002 | 2006 |
|---|---|---|---|---|
| 4.3% | 5.2% | 3.9% | 4.9% | 4.4% |
Tasmania uses proportional representation (the Hare-Clark system) in the House of Assembly. The system is partial preferential, with at least five preferences required.
Legislative Council elections are held separately to House elections. They are held on a periodic six-year cycle, with two or three divisions coming up for election each year. Partial preferential voting is used, but voters only need to number three candidates for the Legislative Council.
Informality rates in the House of Assembly since 1992 have averaged between 4 and 5%, and are generally high in comparison to Federal and other State and Territory levels.
| 1989 | 1992 | 1995 | 1998 | 2001 | 2004 |
|---|---|---|---|---|---|
| 5.7% | 6.5% | 6.7% | 4.3% | 4.0% | 3.0% |
The ACT has used the Hare-Clark system of optional preferential voting for the Legislative Assembly since 1995. It does not have an upper house of parliament.
While the ACT has had consistently low levels of informality in Federal elections, informality for the Legislative Assembly was relatively high in the first three elections after self-government in 1989. Increased informal voting could have been both a reaction to the early years of self-government and confusion about changes in the voting system.
The 1989 and 1992 elections used a modified d'Hondt voting system, in which preferences could be marked both above and below the line. 1995 was the first election to use the Hare-Clark system, in which voters are asked to mark as many preferences as there are vacancies in the Assembly, but a first preference only is considered formal.
After the first Hare-Clark election in 1995, informality dropped at each consecutive election to a low of 2.7% in 2004, despite Federal informality rising in the same period.
| 1990 | 1994 | 1997 | 2001 | 2005 |
|---|---|---|---|---|
| 3.0% | 3.8% | 5.0% | 4.0% | 4.0% |
The Northern Territory uses full preferential voting for the Legislative Assembly, and has no upper house.
The Northern Territory has seen informality rates of between 3 and 5% in the Legislative Assembly in the 1990s, a similar range to the Federal House of Representatives informality levels.
The AEC acknowledges the Traditional Owners of Country throughout Australia and recognises their continuing connection to land, waters, culture and community. We pay our respects to Elders past, present and emerging.